Public Interest Transportation Forum - http://www.bettertransport.info/pitf
Central Link Light Rail Pre-Pandemic was finally delivering average daily ridership results consistent with the earlier commitments made to secure Federal funding.
![]() This page is a living document that is revised and updated periodically.
This page is a living document that is revised and updated periodically.
Light rail ridership a decade after the service opened was in 2019 getting close to meeting the forecast official ridership expectations set in 1996. Those expectation were for a line that has been severely delayed and won't reach the original 2006 expected termini of University District until 2021. However, ridership plunged in 2020 as the Covid-19 pandemic hit. Here is a chart of monthly ridership reported to the National Transit Database through June 2020:

Even with growing ridership -- especially with growing ridership -- and with a growing interest in zoning more residential housing near light rail stations, a new problem may emerge after 2021 for the four car light rail trains of Seattle: overcrowding in peak periods.
In addition to this page, see the charts comparing King County Metrobus boardings with Link Light Rail boardings.
This updated page covers Seattle's light rail daily passenger counts from the first day of revenue service July 20, 2009 through June 31 , 2019. Sound Transit has provided PITF with the data presented here, all of which are estimates subject to change.� Archive of data sheets from Sound Transit is at the bottom of this page.
Seattle Transit Blog posts interesting ridership charts based on monthly aggregates.
PITF posted comments below the October 26, 2012 Seattle Transit Blog story on light rail ridership.
And here. And here.
Authorities plan for the majority of light rail riders to be people commuting to work, and thus there is a focus by Sound Transit and Federal Transit Administration on weekday ridership on non-holidays. The red line on the next chart shows a 15 day moving average of daily weekday light rail ridership-- amounting to three weeks -- that smooths out the daily fluctuations but still allows detection of up or down fluctuations in the weekday ridership that last more than a few days.. The overall ridership trend has been up since opening in 2009, with seasonal variation in the early years, high in summer, lower in winter. Through the opening of University Link in March 2016, this pattern of seasonal oscillation has been consistent for all the years that light rail has been open in Seattle, caused by summer tourism, sports events, and weather. The all-year goal of 37,800 per day was routinely exceeded on particularly busy days in the summers of 2014 and 2015. And back in 2007, Sound Transit agreed with U.S. DOT that the first year jump in ridership when University Link opened would be an addition of 28,600 daily riders, and that has now happened as shown by the red line touching the FTA forecast in orange.
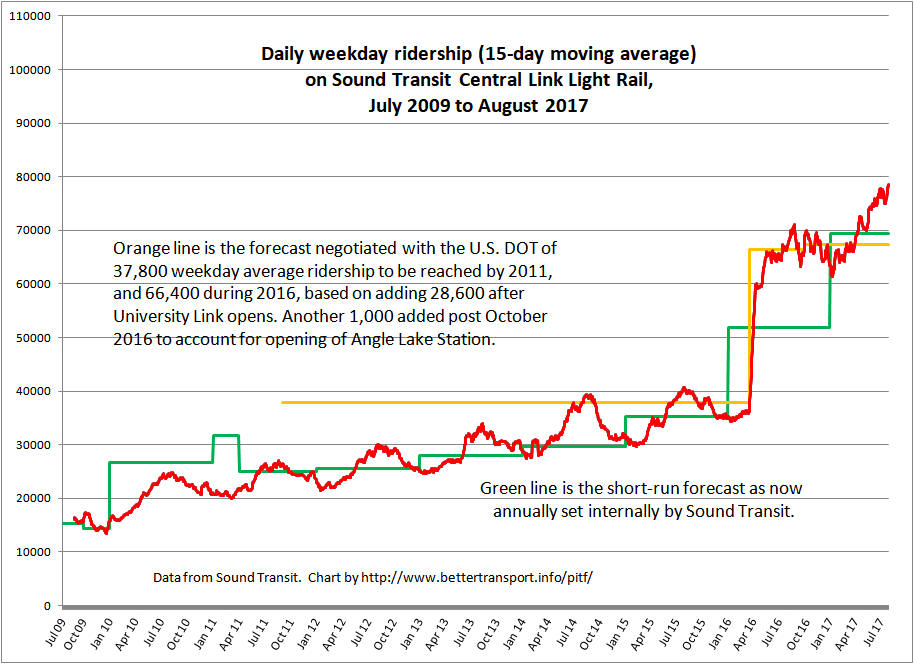
For 2015 the expected weekday average for the entire year was set in the approved budget as 35,300 shown as the level of the green line on the above weekday chart. Beginning in the summer of 2012, light rail began breaking 35,000 riders on weekdays where there was an event at one of the SODO stadiums. In the summer of 2013, breaking 35,000 was no longer unusual, and thanks to a Paul McCartney concert, light rail got to over 40,000 riders in a single day for the first time on July 19, 2013. Since then, thanks to the Seahawks, the capacity of the present system was challenged with 71,500 riders on February 5, 2014.
The Federal Transit Administration (FTA) was told by Sound Transit in 2003 -- as part of the justification for the $500 million Full Funding Grant Agreement (FFGA) -- that by fall 2011 the average weekday light rail ridership would reach 37,800, and annual ridership would be at 11.5 million. As noted in Table 5.1 of the FTA-required Sound Transit Before and After Study, in 2011 Central Link carried 7.8 million passengers compared to the FFGA prediction of 11.5 million, about 32% lower than predicted.� Not until the summer of 2013 did the weekday ridership on a few of the busiest days ever hit 37,800, and not until August 2014 did the weekday average for an entire month go above the 2011 goal. The average weekday ridership for all of 2015 reached 35,573, still below the goal once hoped to be met four years before that. When two new stations opened in March 2016, Sound Transit closed out the ridership counting on the original Airport Link, noting for the record a 2020 goal it no longer needed to think about: "For the Link light rail system operating between Westlake and SeaTac Airport, in 2005 Sound Transit projected 45,200 average weekday riders by 2020. Although ridership was negatively affected by the national recession, after the economy started to recover ridership returned, carrying 35,500 (sic) average weekday riders through 2015. Ridership on Link has grown much faster than other transit in the region ever since it opened in 2009. With continued growth, ridership on Link should reach our 2020 estimates." Once the new stations at University of Washington Husky Stadium and Capitol Hill opened, all concern and interest over the below-target light rail performance levels of 2009 to 2015 evaporated.
To be sure, the Sound Transit and the Federal Transit Administration provided many reasons why light rail ridership in Seattle continuously lagged the forecasts used to justify the expenditure of public resources to build it, even beyond The Great Recession as the primary alibi. The other factors include higher fares than planned, and headways that were implemented at less attractive levels than forecast. This additional excuse from Sound Transit is also intriguing:
"Slow Adoption of New Transit Service in Rainier Valley Corridor. Major transit-dependent populations in the Rainier Valley have not yet fully adopted Link as a transit option. Outreach efforts have shown reluctance by many low income and non-English speaking populations in the Beacon Hill and Rainier Valley neighborhoods to change long-established travel patterns of using local bus routes. Customer service and outreach staff continue working on educational efforts to engage these communities and encourage Link usage as a faster travel option." -- July 2012 draft of Before and After Study, Table 5-1.
![]() The 37,800 daily boardings average was never achieved as an all-year average before the University Link track extension and two additional stations open in 2016, a point when new promises of ridership achievement come into play. What's intriguing now is how Sound Transit has in recent years up until the present kept expectations low for ridership in 2016 and beyond. Unlike with the run up to the initial segment that opened in 2009, the agency has been setting ridership goals it has high confidence in exceeding. The official forecast for daily ridership in 2016 were at first set at 48,500, and 56,600 in 2017, which did not reflect expectations set in 2007 to justify Federal grant support. Then revised, higher forecasts of 51,800 for 2016 and 60,500 for 2017 continued the sandbagging on original expectations for the addition of the two University Link stations in March 2016 and the new Angle Lake station in September 2016. PITF analysis of earlier expectations that Sound Transit put on record to justify Federal funding would put a more reasonable 2016 forecast for average weekday ridership at 66,400 and 2017 at 70,000.
The 37,800 daily boardings average was never achieved as an all-year average before the University Link track extension and two additional stations open in 2016, a point when new promises of ridership achievement come into play. What's intriguing now is how Sound Transit has in recent years up until the present kept expectations low for ridership in 2016 and beyond. Unlike with the run up to the initial segment that opened in 2009, the agency has been setting ridership goals it has high confidence in exceeding. The official forecast for daily ridership in 2016 were at first set at 48,500, and 56,600 in 2017, which did not reflect expectations set in 2007 to justify Federal grant support. Then revised, higher forecasts of 51,800 for 2016 and 60,500 for 2017 continued the sandbagging on original expectations for the addition of the two University Link stations in March 2016 and the new Angle Lake station in September 2016. PITF analysis of earlier expectations that Sound Transit put on record to justify Federal funding would put a more reasonable 2016 forecast for average weekday ridership at 66,400 and 2017 at 70,000.
![]() Finally, in the 2017 Service Improvement Plan and 2017 Annual Budget, Sound Transit officially upped the 2017 Link weekday average ridership forecast to 69,400, shown as the green line on the right hand side of the graphic above. As of July 2017, Sound Transit daily ridership levels are exceeding this goal, so ridership results are finally reaching the levels used to justify the Federal investment. A factor in this achievement is that the two Park & Ride facilities at the Tukwila International Boulevard and Angle Lake Stations are now filled to full capacity every weekday for morning commuters.
Finally, in the 2017 Service Improvement Plan and 2017 Annual Budget, Sound Transit officially upped the 2017 Link weekday average ridership forecast to 69,400, shown as the green line on the right hand side of the graphic above. As of July 2017, Sound Transit daily ridership levels are exceeding this goal, so ridership results are finally reaching the levels used to justify the Federal investment. A factor in this achievement is that the two Park & Ride facilities at the Tukwila International Boulevard and Angle Lake Stations are now filled to full capacity every weekday for morning commuters.
Ball games and other events in the Century Link and Safeco stadiums near Stadium Station are proving to be an important source of ridership on light rail. PITF calculated that from May through September 2012, sporting events brought in an additional 71,000 riders per month. 
Click here to go down the page for more on Stadium Station ridership on light rail.
Higher ridership means more standing on the light rail trains instead of sitting, as shown on the front cover of Sound Transit's 2011 annual report at right. Meeting the ridership forecast would require that even more passengers must stand instead of sit for part of their trip. This condition has been expected by agency planning, but perhaps not so much by Seattle transit riders. Crowded trains may discourage ridership by those who have options. While light rail cars can be packed safely by design with up to 200 riders, PITF has observed the reluctance of passengers on a platform to board after about 150 folks have stepped into a rail car. When University Link opened, the agency raised the stated max passenger loading to 250 per rail car.
Short-term ridership forecasting at Sound Transit is now improving year by year. Since 2012 annual ridership targets have been exceeded by reported results, as shown by the red ridership line going above the green forecast line for at least half the year. But back In 2010 the actual ridership of 7 million all year was more than one million below the forecast of 8.1 million. The average weekday ridership for all of 2010 was 21,026, which was 21% below the short-run forecast. The 2010 forecast was made in fall 2009, a year after the beginning of the recession in 2008 that was blamed by Sound Transit for the ridership being below the short-run forecast in 2010.
PITF is encouraged that Sound Transit has now set strongly growing ridership as an important objective for the region's significant light rail investment made to date.
Public Interest Transportation Forum thanks Sound Transit for its willingness to share data with us, and thus document a unique record of day-by-day development of light rail ridership in a world class city. All data sheets from Sound Transit are posted at the bottom of this page. The route of Seattle's Central Link light rail from downtown to the main regional commercial airport is shown here on a map that also depicts with dotted lines the forthcoming extensions both to the north and the south. Some history of how this line was developed is here on Seattle Transit Blog.
|
This frequently updated summary page on Seattle light rail ridership was referenced in a March 3, 2011 Seattle Times article by journalist Mike Lindblom, "Sound Transit ridership falls short of goals." Expressing the attitude of many rail boosters, Sound Transit Board member Dave Enslow shrugged off below-forecast ridership in this article: "He emphasized the rail lines are a 100-year investment." PITF counters that the interurban regional rail system Seattle had 100 years ago was terminated well before it had seen a century of operation. |
Return to the Public Interest Transportation Forum home page.
Below is additional detail prepared over the past few years for diving deeper into Seattle light rail ridership:
In considering the weekday ridership, note that rail ridership on a new line in any U.S. city typically rises within 18 months to its ultimate level until more stations are opened or the line is extended. William Millar, former head of the American Public Transportation Association, noted this pattern in an interview in 2009, reported by the P-I. Tacoma Link, open since 2003, illustrates this reaching of a plateau in a chart below. As noted earlier, the 2020 forecast -- ultimate ridership -- for the Airport to Downtown segment in Seattle -- considered by itself separately from future extensions -- was 45,000 average daily boardings per weekday. Sound Transit now hopes for 35,300 in 2015, the last full year in which ridership on the Airport to Westlake Center line is forecast separately.
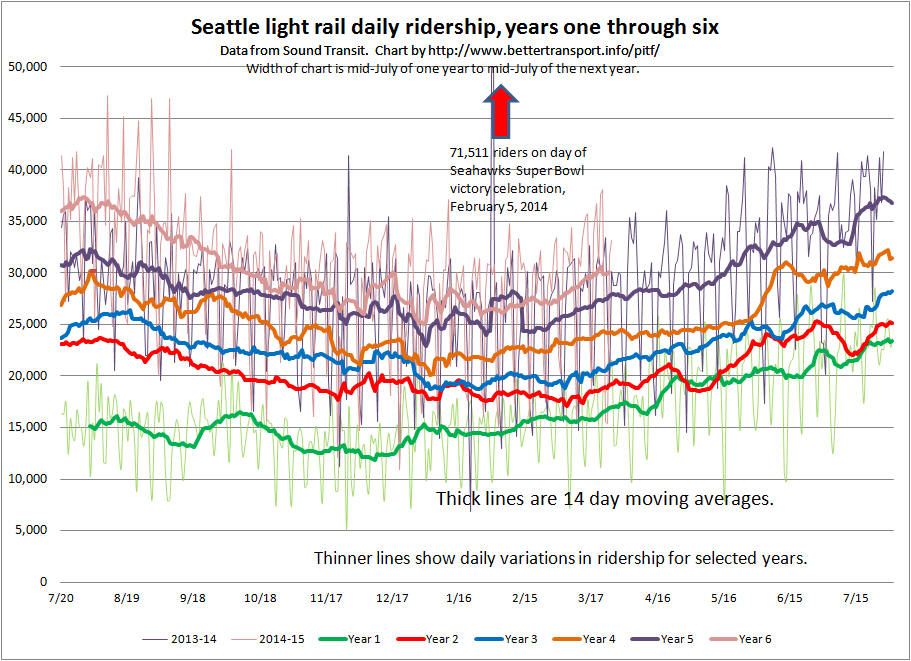
Because weekend ridership has turned out to be important for Seattle's light rail, the next ridership chart provided below shows all days. The first, second, third, fourth, and fifth years of light rail operation are displayed on the same time axis, with the July 20 revenue service start-up anniversary beginning each year. The fainter daily numbers jump up and down considerably, but to indicate what's happening more clearly, the 14 day moving averages of daily ridership � on all days including the important weekends � are shown in thicker lines The first year, July 2009 to July 2010 is in green. The second year, July 2010 to July 2011 is in red. The third year, July 2011 to July 2012 is in blue. The fourth year, July 2012 to July 2013 is orange.� The fifth year is the purple line beginning July 2013 through July 2014.
As the chart illustrates, ridership in the second full year of Seattle's light rail service (in red) did not grow as strongly as in the first year (in green). The blue line of the third year tracked pretty much continuously just above the red line of the second year. The orange line of the fourth year started to trend downward after the SeaFair weekend 2012 summer peak moving average reached about 30,000 per day., although the combination of Seahawks and Husky football at Century Link Field near Stadium Station provided a visible surge during September 2012.� Fall 2012 showed upward bumps because of the Seahawks despite the downward trend. Ridership bottomed out as 2013 began, and a steady upward ridership trend began that turned into a power surge in the mid-May to mid-June period when the Mariners still had hope of a winning season.� Growth continued moderately after that, peaking about the time of SeaFair weekend, and then the fall decline began, shown with the purple line on the left hand upper side of the chart below.� The winning Seahawks and the high price of parking provided more light rail ridership in the last quarter of 2013 than ever before seen in that season. Calendar year 2014 from February through June in dark blue showed the strongest growth trend yet. The one day Seahawks celebration surge on February 5th bumped up the 14 day moving average visibly for -- no surprise -- 14 days. The usual autumn through winter dip in ridership exhibited for the fifth year in a row starting in September 2014.
![]() As shown below, in winter the ridership averages have occasionally bumped into or even crossed below the low winter levels of previous years. For the first time, this did not happen at all in the winter of 2013-14.
As shown below, in winter the ridership averages have occasionally bumped into or even crossed below the low winter levels of previous years. For the first time, this did not happen at all in the winter of 2013-14.
More simple versions of this chart focusing on the month-to-month change in weekday, Saturday, and Sunday/holiday ridership have been created and posted by Seattle Transit Blog from the data posted in the archive at the bottom of this page.
The alignment and stations of Seattle light rail line this year are the same as last year, with the terminus points at Westlake Center in downtown and the Sea-Tac Airport south of the city limits, and eleven stations in between. In February 2010, King County Metro reduced bus services that ran parallel to light rail in the same corridor and deployed more bus trips to serve light rail stations. In 2011-12, King County Metro has had enough funding to maintain bus service to and from light rail stations and thus support Sound Transit's goal of increasing ridership.
|
PITF has received some questions about seasonality of transit ridership. One question has been, does the annual drop in light rail ridership beginning mid-summer and lasting through Thanksgiving and beyond follow a usual pattern of transit seasonality? The answer is no, based on the observation that monthly ridership on Metro bus from 2002 onward has always been greater in October than July. The falling ridership pattern on Link Light Rail exhibited after August is more akin to the ridership pattern on the Seattle Monorail, the Seattle Lake Union streetcar or the former Seattle waterfront streetcar all of which demonstrate peaks of ridership in the summer compared to the rest of the year. As reported in the Before and After Study required by the FTA, "Typically the region sees the highest transit ridership in the fall months when universities and colleges are in session, so ridership on Central Link has shown a different seasonal effect than the rest of the transit services in the region." However, PITF expects that this seasonal pattern will change once the station on the University of Washington campus opens in the first half of 2016. |
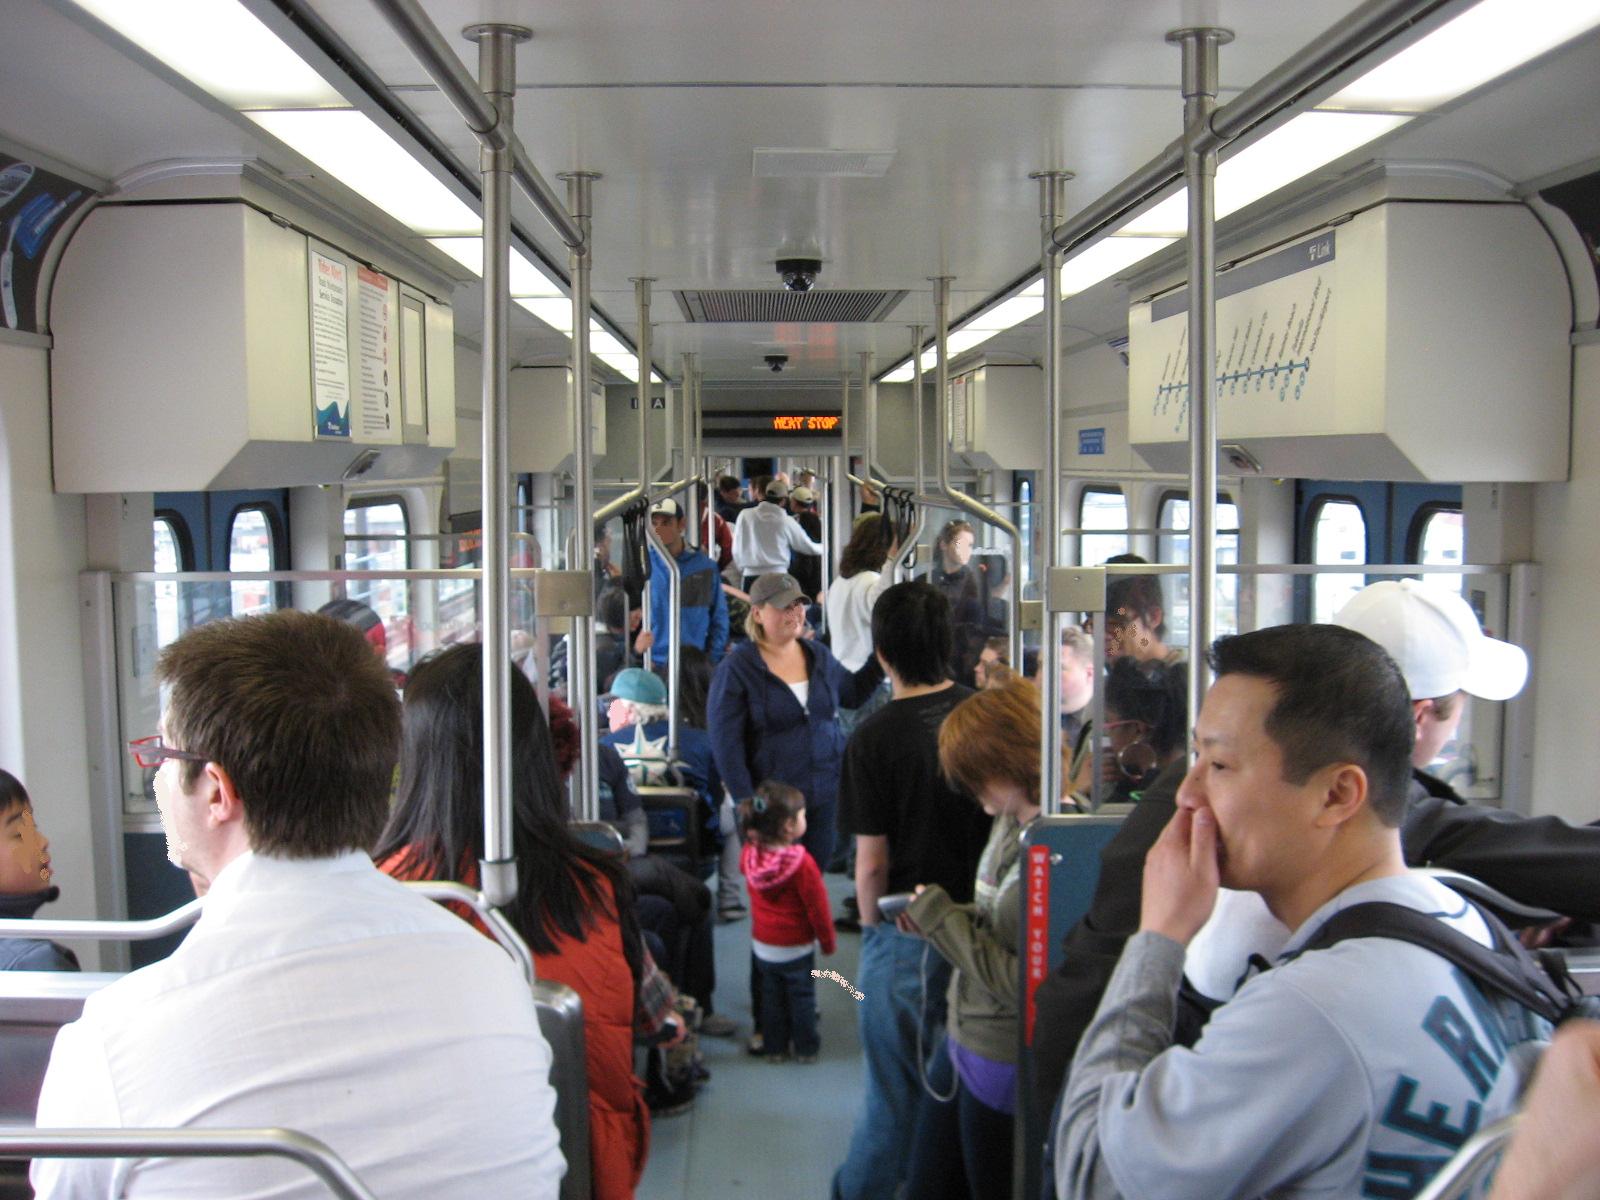
The Mariners, the Sounders, the Seahawks, University of Washington, Sound Transit, and Port of Seattle all promote light rail use for attending baseball, soccer, and football games. Mariners baseball has been a big contributor to Central Link light rail ridership of all the SODO stadium sports. The photo shows a 2010 scene on a Link rail car before the opening day game.
 In a special study, PITF compared light rail ridership on game event days vs non-event days during the four months of June through September, 2012. Light rail weekdays without games average 26,843, while weekdays with games average 30,500 -- higher by 3,658, a gain of 14%. Spread across all weekdays, the Stadium boardings boost up the daily average by about 1,900. On weekends and the two holidays July 4th and Labor Day, the difference is more dramatic. The weekend/holiday average ridership on days without events came in at 19,675. On weekend event days, including the SeaFair weekend, the average was 24,650, higher by 4,975 per day, or 25% above non-event weekend days.
One way of understanding the importance of weekend game day attendance to light rail ridership is to look at the relationship between the average weekday ridership and total annual ridership, a number called the annualization factor. The annualization factor reflects the fact that forecasts involve calculations that come up with daily ridership, and that daily ridership cannot sensibly be multiplied by 365 days per year to get annual ridership. This is because not as many people use transit on weekend and holidays as use it on normal work days. In its forecasting work, Sound Transit expected this annualization factor to be 304. Before seeing the Link Light Rail experience, the agency forecast 26,600 average weekday ridership in 2010 and multiplied by 304 to reach the annual forecast of 8.1 million. Instead, Sound Transit experienced 7 million annual riders with a weekday average ridership of 21,000. You have to multiply 21,000 by 333 to get a 7 million annual number. This means that Sound Transit light rail has a greater reliance on weekend riders for making its year over year gains than was expected earlier.
Furthermore, as noted in the Before and After Study, "Ridership on Central Link experiences a seasonal pattern that peaks during the summer months when more sports events and community events are hosted in downtown Seattle, and the tourist and cruise ship season draws more riders between downtown and the airport. "
One irony arises from the historical fact that the formerly forecast daily average of 45,000 per day was based on a system plan that did not even include Stadium Station and its game day riders. Stadium Station was at first to be deferred until after construction of the Initial Segment was completed in 2009, but that decision was reconsidered in 2005 and station put back into the construction plans for opening in 2009.
For the 2011 revised forecast, Sound Transit had 8.3 million annual riders equivalent to 25,000 per weekday average. The ratio implies an annualization factor of 332, which means the agency is learning from and embracing its real world ridership experience. The 2012 budget forecast for Seattle light rail is 8.4 million annual riders equivalent to 25,455 per weekday average, revealing an annualization factor of 330, coming down a bit but still way above 304 because weekend ridership is so important. The 2013 budget forecast for Seattle light rail is 9.2 million annual riders equivalent to 27,900 weekday average, indicating the annualization factor being held at 330. The actual annualization factor revealed in 2012 is 335, which indicates Sound Transit sandbagged its 2013 forecast to be below what the actual was likely to be, given that the weekday forecast is accurate. In fact, 2013 ridership came in at 9,681,432, five percent above the forecast of 9.2 million.
|
PITF co-founder John Niles critiqued Sound Transit's light rail ridership forecasts in an essay he wrote for the online news blog Publicola, June 1, 2011, followed up by a TV interview of him and Sound Transit Board Member Larry Phillips by Seattle Channel's C.R. Douglas broadcast on City Inside/Out June 10, 2011, and available for web streaming. Shortly thereafter, in a Seattle Transit Blog posting on June 22, 2011, a Sound Transit staffer described in technical terms why the segment of light rail in Southeast Seattle, that is, Rainier Valley, was "most definitely underperforming compared to projections." |
All train rides were free over a year ago on the opening weekend July 18-19, 2009, and the ridership estimate counted by hand for these first two days of light rail was 92,397, with a machine count of 66,792. These two free days -- with boarding levels similar to the 45,000 per day forecast for 2020 even if further line extensions were not completed by then -- are not included on the charts. Regular adult fares are $2.00 to $2.75, depending on distance traveled, up by 25 cents as of June 1, 2011, an increase that was expected to dampen ridership by 1.2%, according to the Sound Transit analysis results from 2010 posted here. Passenger loads during the opening fare-free weekend showed Seattle's light rail certainly has the capacity to deal with the original 45,000 forecast ridership in a day, a conclusion reinforced by the ridership on February 5, 2014, Seahawk Celebration Day..
|
It's been pointed out to PITF that back in 1996 when Sound Transit was winning its initial voter approval for taxing authority, the agency forecast that Seattle light rail by 2006 would have 105,000 riders per day. Of course, as of 2014, citizens of the region know that the agency is now planning to take until about 2021 to complete and open the system from NE 45th to S 200th that is supposed to carry that many people. That's a 15 year delay. |
The pie chart shown next provides a comparison of Link Light Rail ridership for a strong recent month, July 2012 with the ridership for other modes in the same month. King County Metro clearly dominates the transit patronage picture. The comparison is somewhat unfair, because light rail and other rail services run on a single line, while the Metro Bus network covers all of urbanized King County. Central Link can be considered a single line in the King County Metro service territory.
On the other hand, the $2.5 billion Sound Transit capital expenditure over a decade to construct and buy vehicles and equipment for the light rail line has vastly exceeded the approximately $100 million per year capital expenditure for Metro Bus equipment and facilities over a comparable time period.
The next chart shows how monthly light rail ridership in Seattle evolved in its first months of life compared to ridership on the Tacoma Link streetcar and the South Lake Union streetcar.
As one can see, Central Link light rail carries far more people than the streetcar lines shown, and is also showing very wide variations from month to month. The summer tourist bump is somewhat visible on the graph line for the Seattle streetcar of the present day (green line to the right), as well as very visible on the former waterfront trolley car, now discontinued (green line to the left).
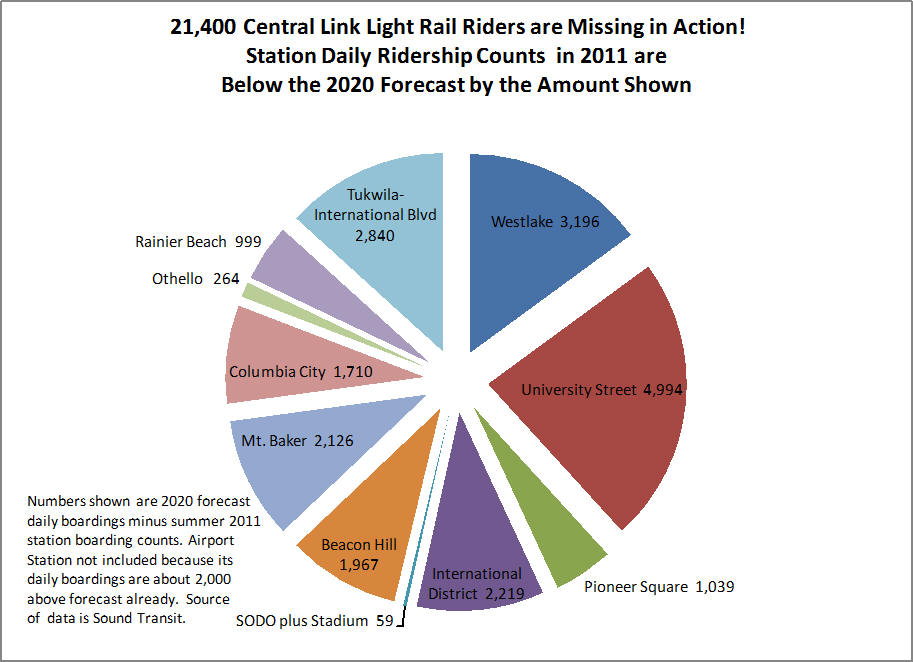
The ridership forecast made by Sound Transit ten years ago for this line as a justification for Federal funding was made station by station. The 21,400 total daily passengers making up the ridership gap below forecast as of last summer are shown for each station in the next chart. The Airport Station is not included because its ridership is already above the 2020 forecast by about 2,000 per day!
The stations from Tukwila to Beacon Hill can be considered the commute shed for Seattle's light rail, and the daily rider boarding shortage shown below for this series of stations comes to 9,900 per day. The resulting 21,400 daily ridership gap below the 2020 forecast of 45,000 is by simple arithmetic not being made up from the 1,900 daily weekday average ridership gained in summer from Stadium Station plus the 2,000 unexpected daily boardings at the Airport.
|
As another source of insight, consider pre-Link weekday average boarding counts for three King County Metro lines covering part of the same or parallel corridors: Route 48: 13,800, Route 7: 11,000, Route 194: 4,800. Link daily ridership beats any one bus line, but of course a comparison should be based on changes in ridership across the entire portion of the network as reconfigured after the train line opens, for the following reason: General transit operating philosophy in bus-rail combined systems is to feed as many bus lines as practical to rail stations in order to deliver bus passengers to what is expected to be a faster, higher capacity mode. Some one-seat bus rides become bus and rail journeys with a transfer during the trip. Depending on the routing and frequency of feeder buses, as well as the route, frequency, and capacity of the train, a transit journey after the advent of rail may or may not be faster and more comfortable for a particular customer than the all-bus predecessor. It is the aggregated response of the entire market to the changes brought by a new rail line that makes for success or failure of a project like Link. This effect can be assessed through looking at ridership trends for bus plus rail in the entire corridor that light rail serves. PITF's overall estimate of light rail riders as of Fall 2010 who were former bus riders was approximately 60% in the Airport market and the Rainier Valley market served by Link, based on raw ridership data collected by Metro and Sound Transit in Fall 2008 and Fall 2010. The drop in bus ridership divided by rise in rail ridership (from zero) came out to be 55% for routes to SeaTac Airport and 67% for Rainier Valley to downtown. This calculation suggests that 55 to 67 percent of rail riders are former bus riders. As required by the Federal Transit Administration, Sound Transit has conducted a "before and after study" of Link light rail comparing Fall 2008 with Fall 2011. This report notes, "After Central Link was implemented, a similar level of bus service hours remained in the project corridor. Resources from truncated or eliminated routes were generally reinvested in the corridor, resulting in a similar amount of service hours....Transit commuting in King County Metro did its own study in the fall of 2010, and from this study the drop in bus ridership on parallel Metro bus routes that occurred simultaneously with the ramp up of rail ridership can be extracted. |
Note: Sound Transit states that the daily readings charted on this page are estimates and subject to revision.
Through field observations, PITF estimates that Sound Transit is using photoelectric "beam" passenger sensors above the eight doors on twenty of the first 62 rail cars to be put into service and then extrapolates to all the cars on all runs during a service day. This way of counting passenger rail boardings is standard in the U.S. transit industry. Following further revisions, numbers similar to the above will be Sound Transit's official report on passengers served provided to the public and U.S. Government. Sound Transit's quarterly ridership reports to the public are posted here.
Sound Transit also compiles boarding and exiting counts of customers at the various light rail stations.
February 6, 2010 through February 4, 2011 is posted here.
Station boarding & exit data received May 2013: Feb. 5, 2011 to Feb. 17, 2012 Feb. 18, 2012 to Feb. 15, 2013
![]() Station boarding & exit data received March 2015: Feb. 16, 2013 to Feb. 14, 2014 Feb 15, 2014 to Feb. 13, 2015
Station boarding & exit data received March 2015: Feb. 16, 2013 to Feb. 14, 2014 Feb 15, 2014 to Feb. 13, 2015
Ridership is highly seasonal. Using the data for Summer 2012 and Fall-Winter 2012-13, the drop from the light rail summer ridership high can be observed at the station level. The largest drops occur at both ends of the line, Westlake Center and the Airport, and at Stadium Station. Ridership actually rose a bit at Beacon Hill and Mount Baker, probably because of student ridership.
When all the stations are in view and clustered into geographic groupings, as below, the seasonality of ridership is evident, although the patronage at the five residential neighborhood stations in Seattle between and including Beacon Hill to Rainier Beach shows no seasonality and ongoing growth.
Click here for the data sheet (pdf) provided by Sound Transit to PITF on August 20, 2009.
September 8, 2009 October 5, 2009 November 9, 2009 December 15, 2009 January 12, 2010 February 1, 2010 revisions
February 23, 2010 March 19, 2010 April 15, 2010 June 10, 2010 June 21, 2010 July 12, 2010 August 16, 2010
September 9, 2010 October 18, 2010 November 10, 2010 December 22, 2010 January 27, 2011 March 2, 2011
March 29, 2011 April 30, 2011 May 18, 2011 June 22, 2011 (revised March count) June 22, 2011 (revised April Count)
June 22, 2011 (May count) July 29, 2011 August 19, 2011 September 19, 2011 October 29, 2011 November 19, 2011
December 10, 2011 January 12, 2012 February 24, 2012 March 27, 2012 April 24, 2012 May 17, 2012 June 27, 2012
July 26, 2012 August 27, 2012 September 26, 2012 October 17, 2012 November 15, 2012 December 20, 2012
January 23, 2013 Februrary 20,2013 March 8, 2013 April 16, 2013 May 18, 2013 July 26, 2013 (May)��� July 26, 2013 (June)
August 5, 2013�������� October 30, 2013 (August) October 30, 2013 (September) October 2013 November 2013 December 2013
January 2014 February 2014 March 2014 April 2014 May 2014 June 2014������July to December 2014 January to March 2015
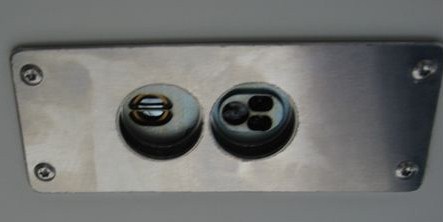
Photo of the automated passenger counting electronic eye on Link rail cars number 101 to 110, about a third of the first cars put in service. As of October, 2010 cars numbered 111 to 135 do not have these counters installed. PITF estimates that cars numbered 136 through 145 of the next 27 cars have counters installed, but observed cars 146 and above do not. Total boarding counts are extrapolated from numbers recorded on the cars where the counters exist.
Click here for complete information from Sound Transit on riding Central Link Light Rail.
Return to the Public Interest Transportation Forum home page.
Last modified: {C}{C}{C}August 26, 2017{C}{C}{C}