![]()
by John Niles, Public Interest Transportation Forum Co-founder and Editor
![]()
Transit and carpool market share forecasts are revised downward in new documents from PSRC
![]()
The transportation planning agency for the Seattle-Tacoma-Bellevue-Everett-Bremerton region of Washington State is updating its long-range plan as of summer 2006, with forecasts for the performance of the approved Destination 2030 Metropolitan Transportation Plan provided in the Vision 2020 Update.
Puget Sound Regional Council (PSRC) prepares the transportation
plan for four counties -- King, Pierce, Snohomish, and Kitsap --- under mandates
and assignments of authority and responsibility from both state and federal
government. As part of this planning effort, PSRC issued a draft environmental
impact statement (DEIS) in spring 2006 to update earlier planning work.
Data displayed inside the transportation chapter of this draft EIS (external pdf) is very revealing of public transportation's future under the Destination 2030 Metropolitan Transportation Plan issued in May 2001. Selections from the new DEIS are excerpted below on this page.
The DEIS forecasts that the transit market share in 2040 will reach just 11.6% of work trips, and 2.5% of non-work trips, if present policies are pursued and the implementation of Destination 2030 continues.
As context, in the May 2001 version of the Destination 2030 Metropolitan Transportation Plan, the forecast for 2030 transit mode share was 11.8% for work trips and (by calculations using PSRC's numbers) 3.3% of non-work trips. In other words, the PSRC's expectations for transit use in the future are headed downward, despite the inclusion of 125 miles of Sound Transit's High Capacity Transit system in the Destination 2030 Plan.
Every bit of Sound Transit's most expensive Phase 2 Plan trial scenario -- requiring a half-cent hike in the regional sales tax -- is assumed to be in operation for the disturbing scenario forecasts presented on this page.
The Puget Sound Regional Council Draft document summarized on this page can be understood as a new prediction that shows less benefit than was previously expected from Sound Transit's multi-billion dollar passenger railroad schemes.
PSRC's new DEIS document suggests that major changes in regional public policy are needed to achieve by 2040 the transit mode share that was just five years ago forecast to occur by 2030. The major change -- implementation of the "Metropolitan Cities" alternative described below -- would push work-trip transit mode share from 11.6% under present policies to 11.7% and non-work-trip transit use from 2.5% to 3.1%.
| Falling Transit Market Share | |||
| 2001 Forecast for 2030 based on policies and plans | New 2006 Forecast for 2040 with same policies and plans | New 2006 Forecast for 2040 with major policy changes | |
| Work Trips | 11.8% | 11.6% | 11.7% |
| All Other Trips | 3.3% | 2.5% | 3.1% |
The difference between the first and last column of the table reveals a drop from the 2001 forecast!
Furthermore, the uncertainty in forecasts like these for more than 30 years in the future is enormous as explained by Nelson and Niles in a paper (pdf file) posted here.
Revised forecasts of future transit performance may be charitably attributed to increasing sophistication in PSRC's planning methodology.
Take a look:
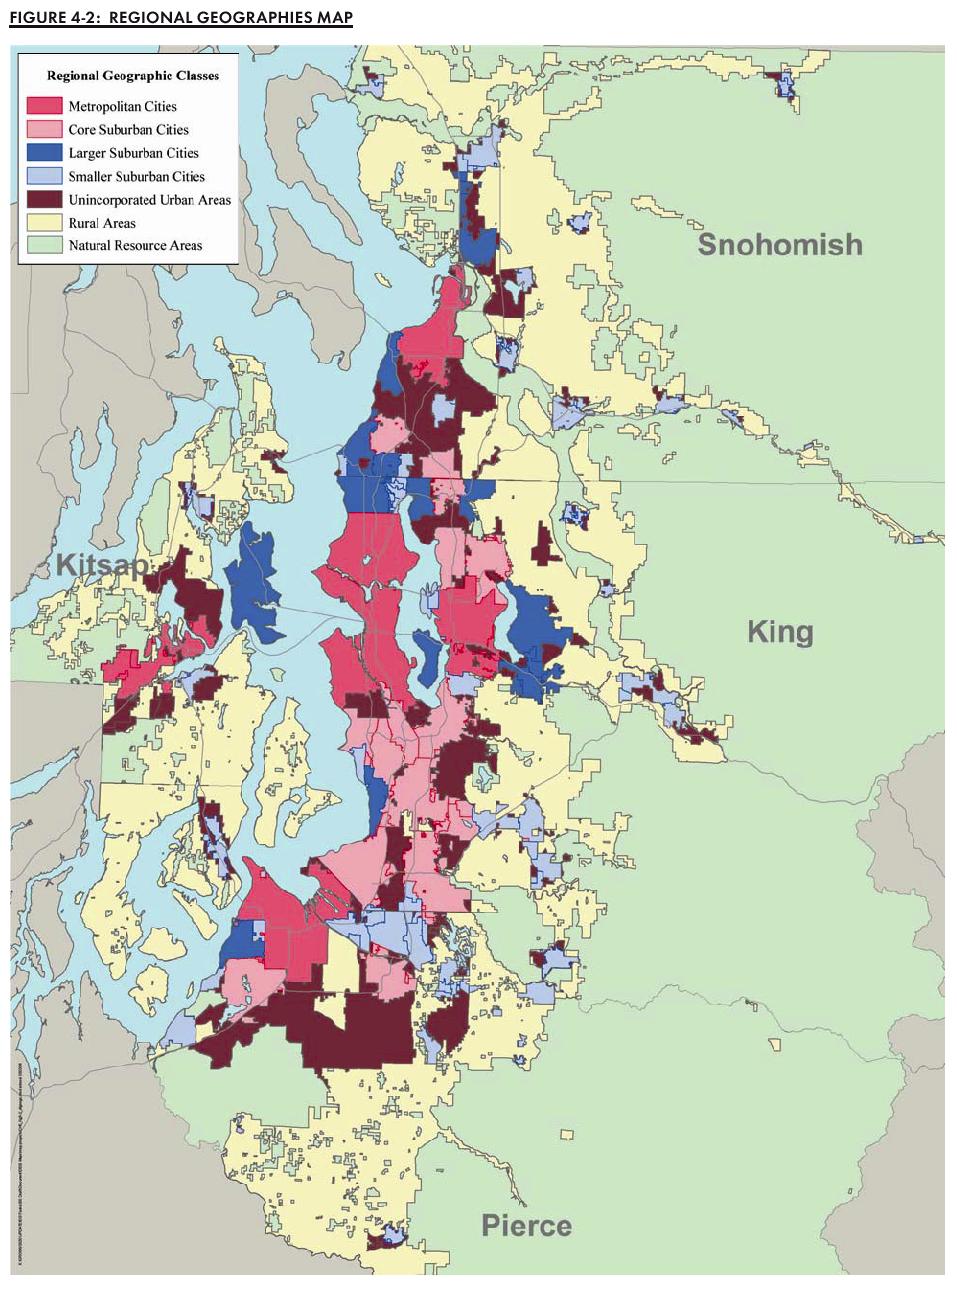
PSRC's categorization of the central Puget Sound geography appears in DEIS as on the following map. The five highest population municipal jurisdictions -- Seattle and the others named in the lead paragraph above -- are termed "Metropolitan Cities." Suburbs of these largest places are tiered by population into three categories of urban city: core, larger, and smaller. These suburban municipal jurisdictions of all size are within the Urban Growth Area required by the State of Washington's Growth Management Act.
Remaining territory inside of the formally-described Urban Growth Area is termed "Unincorporated Urban Areas." The remaining sections of the four counties in the region are either in rural areas or natural resource areas, the latter being mostly forests (green on the map below). Public policy set by the Growth Management Act is that regional population growth should be mostly constrained to take place within the Urban Growth Area (UGA).
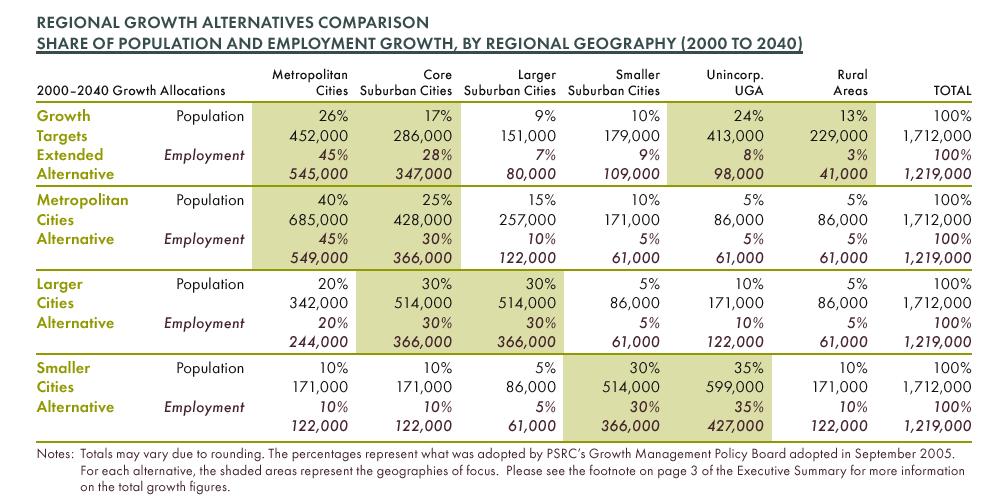
As part of the planning exercise, PSRC created computer models forecasting transportation results for the year 2040 that would occur with four alternative future scenarios for the distribution of population growth inside the UGA. The four scenario alternatives are shown in the following table.
The Growth Targets Extended Alternative is a continuation of present trends and shows 73% of new employment locations ending up in the Metropolitan and Core Suburban Cities, while only 43% of new population growth occurs there. This trend of more offices in the main cities and most housing in the suburbs is driven by the high cost of housing in Seattle and Bellevue. At the same time, 37% of population growth goes to the fringes of the region in unincorporated and rural areas, with only 11% of new employment locations ending up in the fringes. This scenario is considered to be the "No Action Alternative" that represents currently adopted public policy, and would presumably continue if no action were taken to alter the current pattern of development.
Journalist Eric Pryne described the reality of today's separation of housing and jobs in a Seattle Times article July 22, 2006 available here (external link).
The three remaining alternatives in the DEIS from PSRC place differing proportions of population growth and employment growth in the various categories of the regional geography, and represent quite large shifts from the present trend line. These represent a basis for a regional conversation on how transportation investment decisions are being made.
As seen in the table below, the PSRC's Metropolitan Cities Alternative severely clamps down on population growth in the geographic fringe and puts more population and employment growth into the three largest categories of cities. This is the alternative that seems to be the most consistent with the present trend of regional land use and transportation planning policy.
| Flash: Seattle Mayor Greg Nickels endorses PSRC Metropolitan Cities Alternative, supporting the addition of 60% more residents to the City, as described in Seattle PI news article, August 19th, 2006, "Seattle: Home to 1 million? Some say mayor's idea of adding 350,000 to the city is 'laughable'" by Angela Galloway. |
The Larger Cities Alternative also limits fringe growth, but also shows lower population and employment growth in the five metropolitan cities, so that the growth focus is on the core and larger suburban cities.
The Smaller Cities Alternative puts 65% of growth into smaller suburban cities and the unincorporated areas, with growth in the metropolitan and core suburban cities reduced by more than 50% from the No Action case.
Following is a table detailing how population and employment growth were allocated in each of the scenarios.
What is interesting about all of these alternatives is the degree of change in transportation performance that is revealed by the computer model projections, assuming that the amount of overall trip-making remains the same no matter which scenario is considered. The following results are exactly as presented in the EIS.
![]()
"Accessibility of Activities by Transit," the fifth measure from the top in the graphic just above, is a measure that stands out as singularly higher for the Metropolitan Cities alternative, and much the same for all other cases; note the red oval above that marks this result. What this measure means is the fraction of regional employment that is within a 10-minute walk, a 20-minute bicycle ride, or a 30-minute transit ride for regional residents.
Using a 30 minute transit ride as the "limit" for this measure is significant, because, the average travel time for the one-way commute to work in a car is revealed to be 25 minutes today (year 2000), and 29 minutes in 2040 under the No Action scenario.
What is very noteworthy, as seen in the following table from the DEIS, is that the fraction for Accessibility by a 30 minute or less transit ride is below two percent for the base case, and for all alternatives as well! For all cases except for the Metropolitan Cities Alternative, this measure of transit accessibility is below one percent, and does not rise above the level achieved today!
PITF estimates that PSRC is using the data on this page to tilt regional citizens toward embrace of the Metropolitan Cities Alternative, since improved access to work sites by transit is a core transportation policy of the region.
Another interesting observation in the above graphic is the impact of the various alternatives on freeway and expressway travel. Relatively small reductions in total use of these freeways (top blue circle in above graphic) results in dramatic reductions in delay on the freeways and expressways (middle and lower blue circles).
![]()
The table above as presented by PSRC in its DEIS [with the carpool/vanpool mode share inserted by PITF] The published version does not indicate the carpool/vanpool market share. Carpool/vanpool use is very important for cost-effectively reducing the number of vehicles on the road during peak periods. PITF has entered what is assumed to be this part of the market mix by entering a new additional carpool/vanpool number for work trips that forces the sum of mode shares to reach 100%. Interestingly, and perhaps explaining the omission of this number by PSRC, the 7% to 8% range indicated now for 2040 is dramatically lower than the 32.5% share forecast for 2030 in the 2001 version of the Metropolitan Transportation Plan. This drop screams for an explanation by PSRC.
The table above forecasts how much difference will be made in our region by
the completion of Sound Transit's light rail transit program
(Everett-Seattle-Tacoma and cross-Lake to Bellevue and Redmond) plus some kind
of BRT in the I-405 corridor, AND coupled with extreme urban densification in
the "Metropolitan Cities Alternative."
As an attempt to put the best possible light on the potential of much more
densification in the Metropolitan Cities Alternative to reduce solo driving,
here is a simplified excerpt from the table above from PSRC that focuses on the
best case:
| Base Year 2000 Actual Experience | New Policy of Much More Densification, 2040 Forecast |
Current Densification Policies Extended,
2040 Forecast |
Modeled Superiority in 2040 of Much More Densification Compared to Current Policies | |
| Traffic Delay (Seconds/VMT) | 11 | 21 | 32 | Cuts traffic delay growth by more than half |
| Average Commute Time | 25 minutes | 25 minutes | 29 minutes | Maintains today's travel time |
| Non-SOV travel modes | 20% | 26% | 24% | SOV share reduction is 50% higher |
With this alternative, traffic delay measured in seconds per vehicle mile
traveled (VMT) is forecast to double from 11 seconds to 21 seconds, an increase
of 10 seconds. But, the average one-way commuting time is
forecast to remain in 2040 where it was as of 2000, 25 minutes.
How come? Well, more people are forecast to be riding transit or HOV/biking/walking,
the non SOV travel modes: the solo driving market share for commuting is
forecast to drop from 80% to 74%, with a corresponding pick up in transit/HOV/bike/walk
share from 20% to 26%.
But, as shown in the third column of numbers, building out Sound Transit's
system, but continuing present growth policies with no extra push on
densification, delay per vehicle mile is forecast to go from 11 seconds in 2000
to 32 seconds in 2040, a 21 second increase, and the transit/HOV/bike/walk
commuting market share goes from 20% to 24%. This is not as good a result as is
forecast to occur with more densification of housing and jobs in the
Metropolitan Cities Alternative.
In other words, the official PSRC computer modeling shows that a new push to
increase densification cuts the growth in traffic delay more than in
half, and boosts the transit/bike/walk market share growth by 50%, from a
4 point growth to a 6 point growth.
Also, without the densification push, average one-way commute time is forecast
to be 29 minutes in 2040, up 4 minutes from the 2000 time of 25 minutes, instead
of forecasting no increase.
Question: Setting aside questions about the feasibility of the extreme densification called for in the Metropolitan Cities Alternative, what are the assumptions about the seasonal impact of weather and winter darkness on an overall daily increase in walking/biking (shown in the PSRC Figure 5-3-4) from 4.5% to 7.2% of commute trips, a 60% increase?
Another question that arises from the table is how to evaluate the precision of the forecasts for vehicle miles traveled and vehicle hours traveled on freeways and arterials. Consider, for example, the difference between the Metropolitan Cities scenario and the Growth Targets Extended scenario: the freeway vehicle miles traveled drop by about 2.2 million, or about 4%, which causes total freeway delay to drop by 521,000 hours per day, or 42%. That is, the improvement in freeway delay is highly leveraged against freeway vehicle miles traveled, a relationship that makes sense considering traffic dynamics. Traffic converts from free-flow to congestion when just a few more cars enter the stream. However, if the forecast for a drop in freeway VMT in 2040 in the Metropolitan Cities Alternative is too high, then the reduction in congestion won't happen. How precise can PSRC be in its forecasts for reduced freeway use in the year 2040?
According to the DEIS the (only) "Significant Unavoidable Adverse Impacts" in
transportation occur in two of the four future scenarios, as follows:
By implication, the lack of "significant unavoidable adverse impacts" for the two remaining scenarios, Metropolitan Cities and Larger Cities, makes them more desirable from a transportation impact point of view. |
![]()
Return to the Public Interest Transportation Forum home page.
![]()
Last modified: February 07, 2011